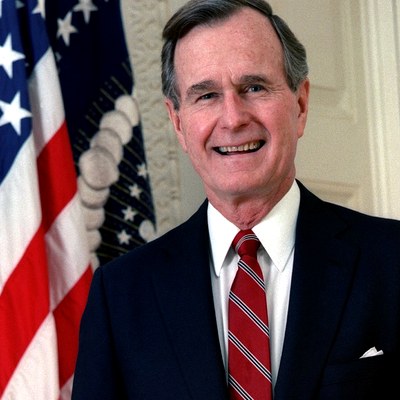
Bush 41
1989–1992
- Annual
- 4.4%
- Term
- 18.7%
- Peak yr
- 1990
The Record
Brick is the average annual rise in the CPI. Steel is how much prices rose over the whole term. Play from Bush 41 forward. The worst year on this chart is 2022 (8.0%).
Average annual
2.8%
38 years shown
Cumulative
180.0%
compounded over shown years
Peak year
8.0%
2022
At this president

Trump 2
2025–2026 · YTD
Bush 41
1989–1992

Clinton
1993–2000

Bush 43
2001–2008

Obama
2009–2016

Trump 1
2017–2020

Biden
2021–2024
Trump 2
2025–2026 · YTD
Portrait video for X. Open the stage, press Replay, or download the MP4.